
[ad_1]
This post was originally published on TKer.co
Stocks ticked lower last week, with the S&P 500 declining 0.7%. The index is now up 10.9% from its October 12 closing low of 3,577.03 and down 17.3% from its January 3 closing high of 4,796.56.
On Thursday, I had the privilege of speaking to a class taught by Greg Harmon, one of the savviest minds in trading. Harmon teaches financial markets at Case Western Reserve University’s business school.
Below are some charts I shared with his class. They’re a reminder for investors to be cautious with news headlines that may belie a greater, more nuanced truth. TKer subscribers may recognize some of them.

The stock market sorta reflects the economy. But also, not really. The S&P 500 is more about the manufacture and sale of goods. U.S. GDP is more about providing services. Read more here.
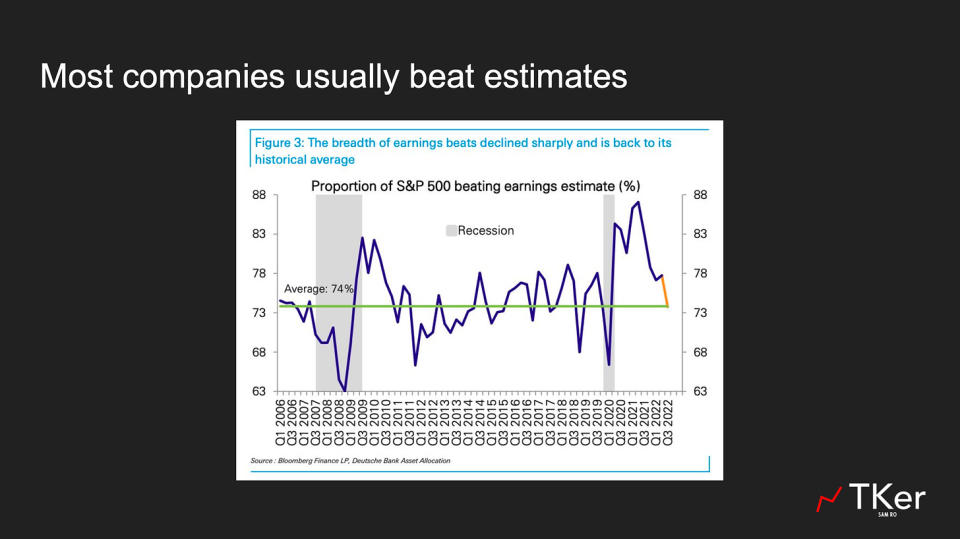
Beating expectations is generally a good thing. But when it comes to earnings announcements, “better-than-expected” has lost its meaning. Read more here.

Stock buybacks can lead to lower share counts. But is it a major driver of EPS growth? No. Read more here.
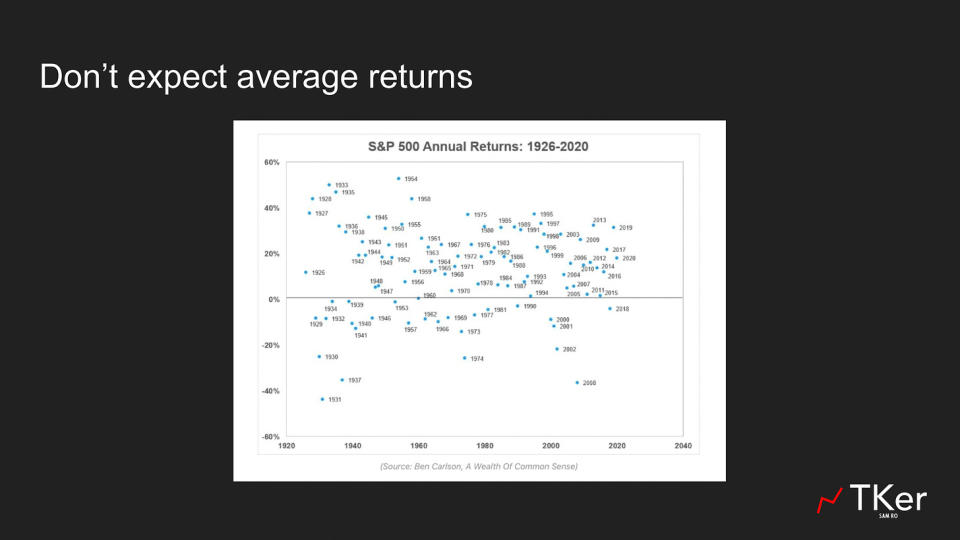
While the stock market returns about 8-10% per year on average, you rarely ever see the market produce an average return in a given year. Read more here.
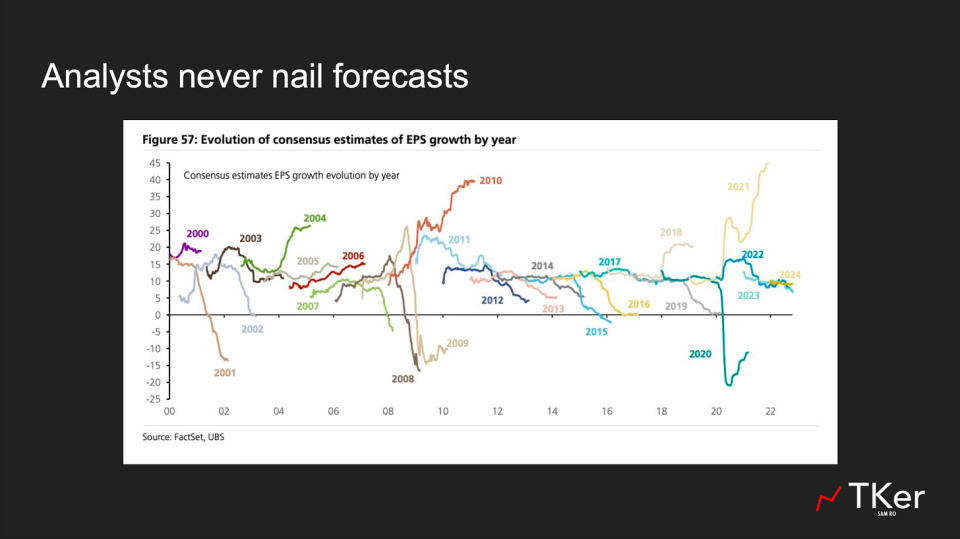
Analysts’ forecasts are not destiny. They’ll get revised up, and they’ll get revised down. Manage your expectations with analysts’ expectations. Read more here.
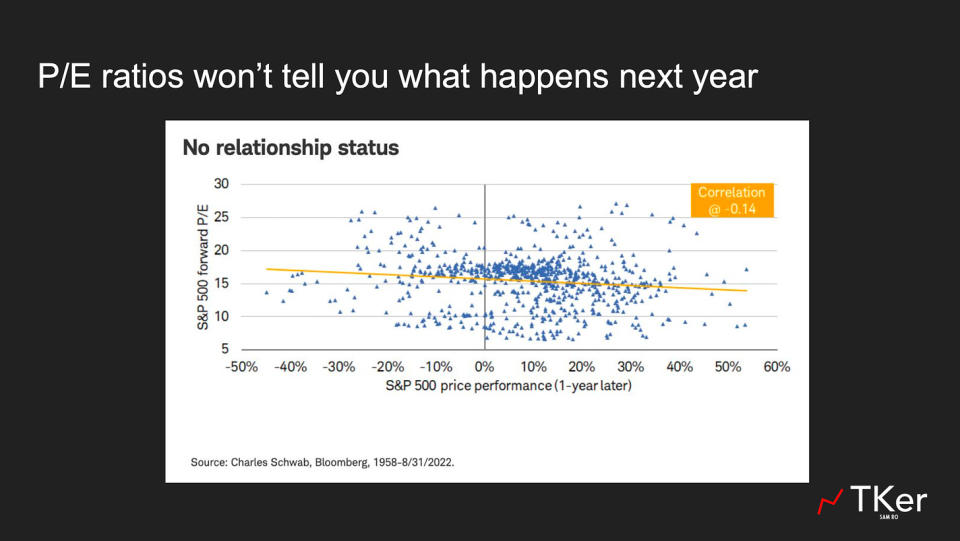
A high or low P/E ratio won’t tell you where prices are headed next year. Read more here.

Employers lay off lots of workers every month, even during boom times…
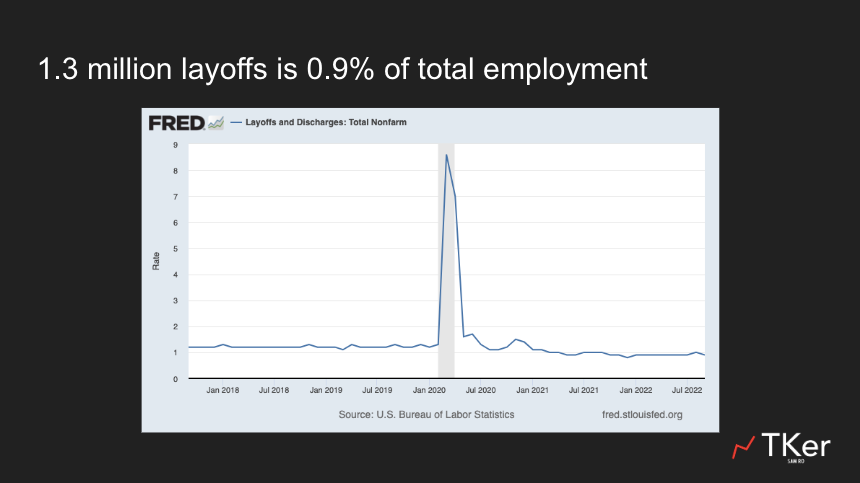
… BUT even 1.3 million layoffs in a single month represent just 0.9% of total employment. Read more here and here.
While we’re on the subject of layoffs, it’s important to understand that all of the tech layoffs we’re reading about are not a sign that widespread layoffs are coming. Among other things, tech represents a very small share of total employment in the U.S. Read more here.
—
More from TKer:
Reviewing the macro crosscurrents 🔀
There were a few notable data points from last week to consider:
🚨 Consumers are spending. Retail sales jumped 1.3% in October, the biggest gain in eight months. Excluding autos and gas, sales were up a strong 0.9%.
Most retail categories saw gains.
🛍 Retailer anecdotes were mixed. Here are some headlines from the past week:
-
Walmart raises outlook as groceries boost sales, inventory glut recedes – CNBC
-
Target posts huge earnings miss as consumers pull back – Yahoo Finance
-
Lowe’s, Home Depot Beat Earnings Amid Housing Slump – Investor’s Business Daily
-
TJX posts mixed earnings with profit above estimates but sales slightly light – MarketWatch
Keep in mind that these are just anecdotes. While an individual company’s performance is certainly affected by macroeconomic trends, they also face company-specific issues that may cause them to underperform or outperform their categories.
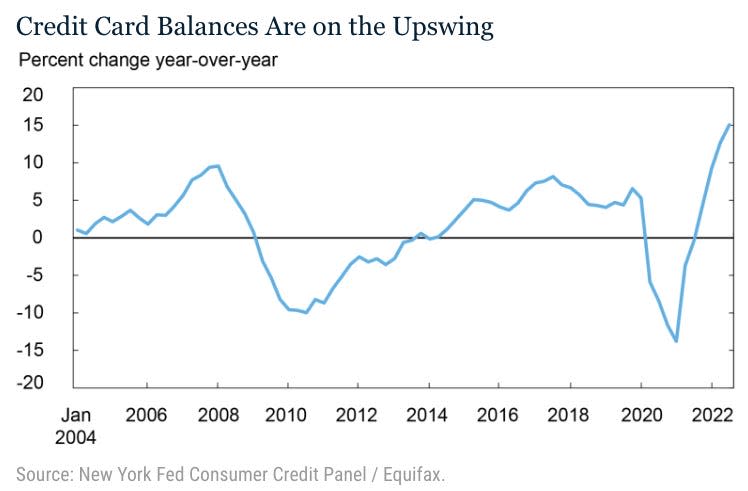
💳 Credit card balances are up. According to New York Fed data released Tuesday, household credit card balances jumped 15% in Q3, the biggest increase in at least 18 years of data.
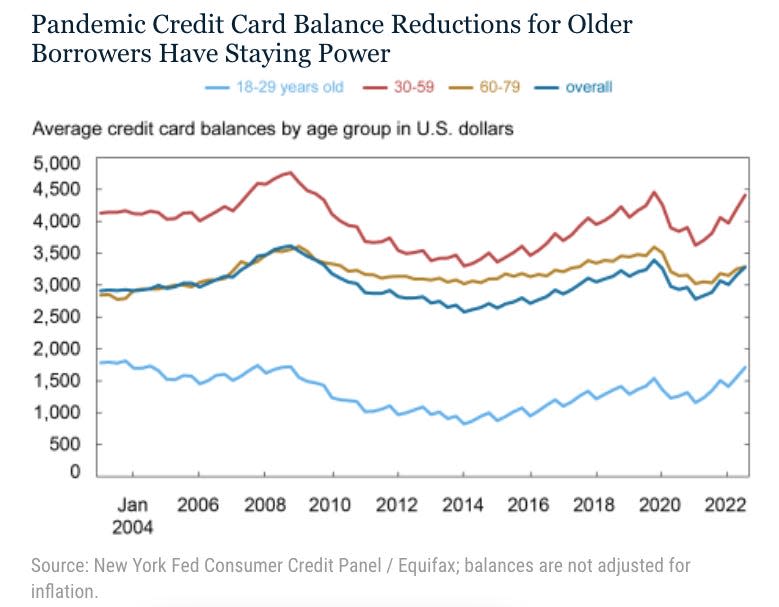
Younger borrowers are carrying higher balances than before the pandemic.
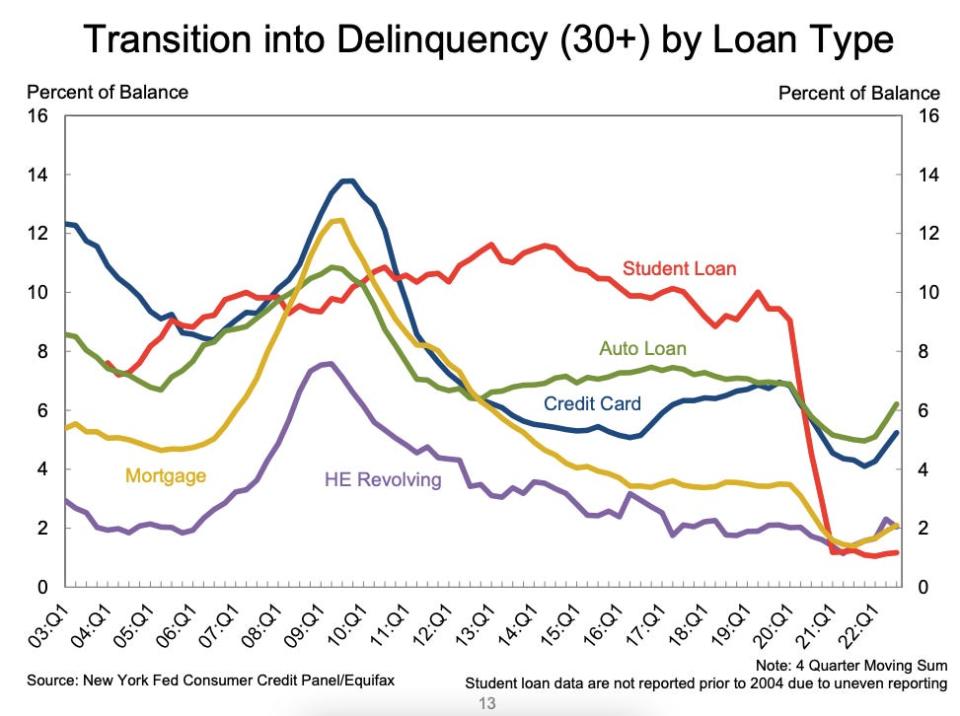
While delinquencies are ticking up, it’s important to note that they’re below pre-pandemic levels. In other words, delinquencies are normalizing.
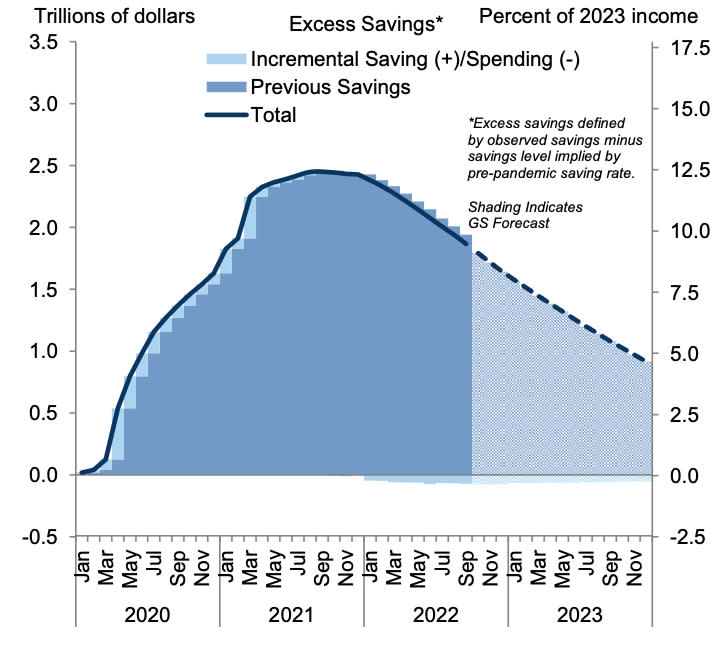
💵 Consumers still have a lot of excess savings. From Goldman Sachs: “…we estimate that households have drawn down about 25% of their excess savings so far and will have spent around 60% by end-2023.“ For more on excess savings and consumer financial strength, read this.
👍 Wholesale price inflation cools. According to the BLS, the producer price index in October was up 8.0% from a year ago. Adjusted for food and energy prices, core PPI was up 6.7%.
😞 Expectations for inflation got worse. From the NY Fed’s Survey of Consumer Expectations: “Median inflation expectations increased at both the one- and three-year-ahead horizons in October, by 0.5 and 0.2 percentage point, respectively, to 5.9% and 3.1%. Both increases were broad-based across age, education, and income groups… Median five-year-ahead inflation expectations, which have been elicited in the monthly SCE core survey on an ad-hoc basis since the beginning of this year and were first published in July 2022, increased by 0.2 percentage point to 2.4%…“
🥪 Food prices are cooling. From Bloomberg’s Javier Blas: “Take the monthly food-cost index compiled by the United Nations’ Food and Agriculture Organisation. Over the last two years, it surged inexorably higher, posting year-on-year increases of as much as 40% by the middle of 2021, and 20% to 30% in early-to-mid 2022. Since then, however, the index has fallen back sharply, paring its annual gains in October to just 1.9%. Based on current trends, the FAO index is likely to post in November its first annual drop in more than two years.“
🌾 Food giant says prices are coming down. From Bloomberg: “Food prices will probably decline next year, even as global crop stockpiles stay very tight, especially for oilseeds, said David MacLennan, chief executive officer of Cargill Inc., America’s largest private company.“
🦃 No Thanksgiving inflation at Walmart. From Axios’ Hope King: “Prices for a ‘typical Thanksgiving meal’ will be the same as last year, Walmart CEO Doug McMillon said on a call with analysts Tuesday morning.“
[ad_2]
Read More: A few charts to remember before you jump to conclusions
2022-11-20 17:00:52